Aruba Central is a powerful cloud networking solution with AI-powered insights, workflow automation, and robust security that enables IT to manage and optimize campus, branch, remote, data center, and IoT networks from a single dashboard.
This post will show you how to create a custom dashboard for Aruba Central using the Rest API functionality, python backend and a Flask web framework.
Before you Begin
Copy the files from Github – https://github.com/WifiGuyWill/central-dashboard
Install the dependencies
Python 3.8
Flask 2.0.1
Steps to Configure the custom dashboard
To configure the Flask web application, complete the following steps:
- Step 1: Install the dependencies
- Step 2: Copy the /central-custom-dashboard folder
- Step 3: Modify creds.py with API key
- Step 4: Execute the flask app (flask run)
Main Dashboard:

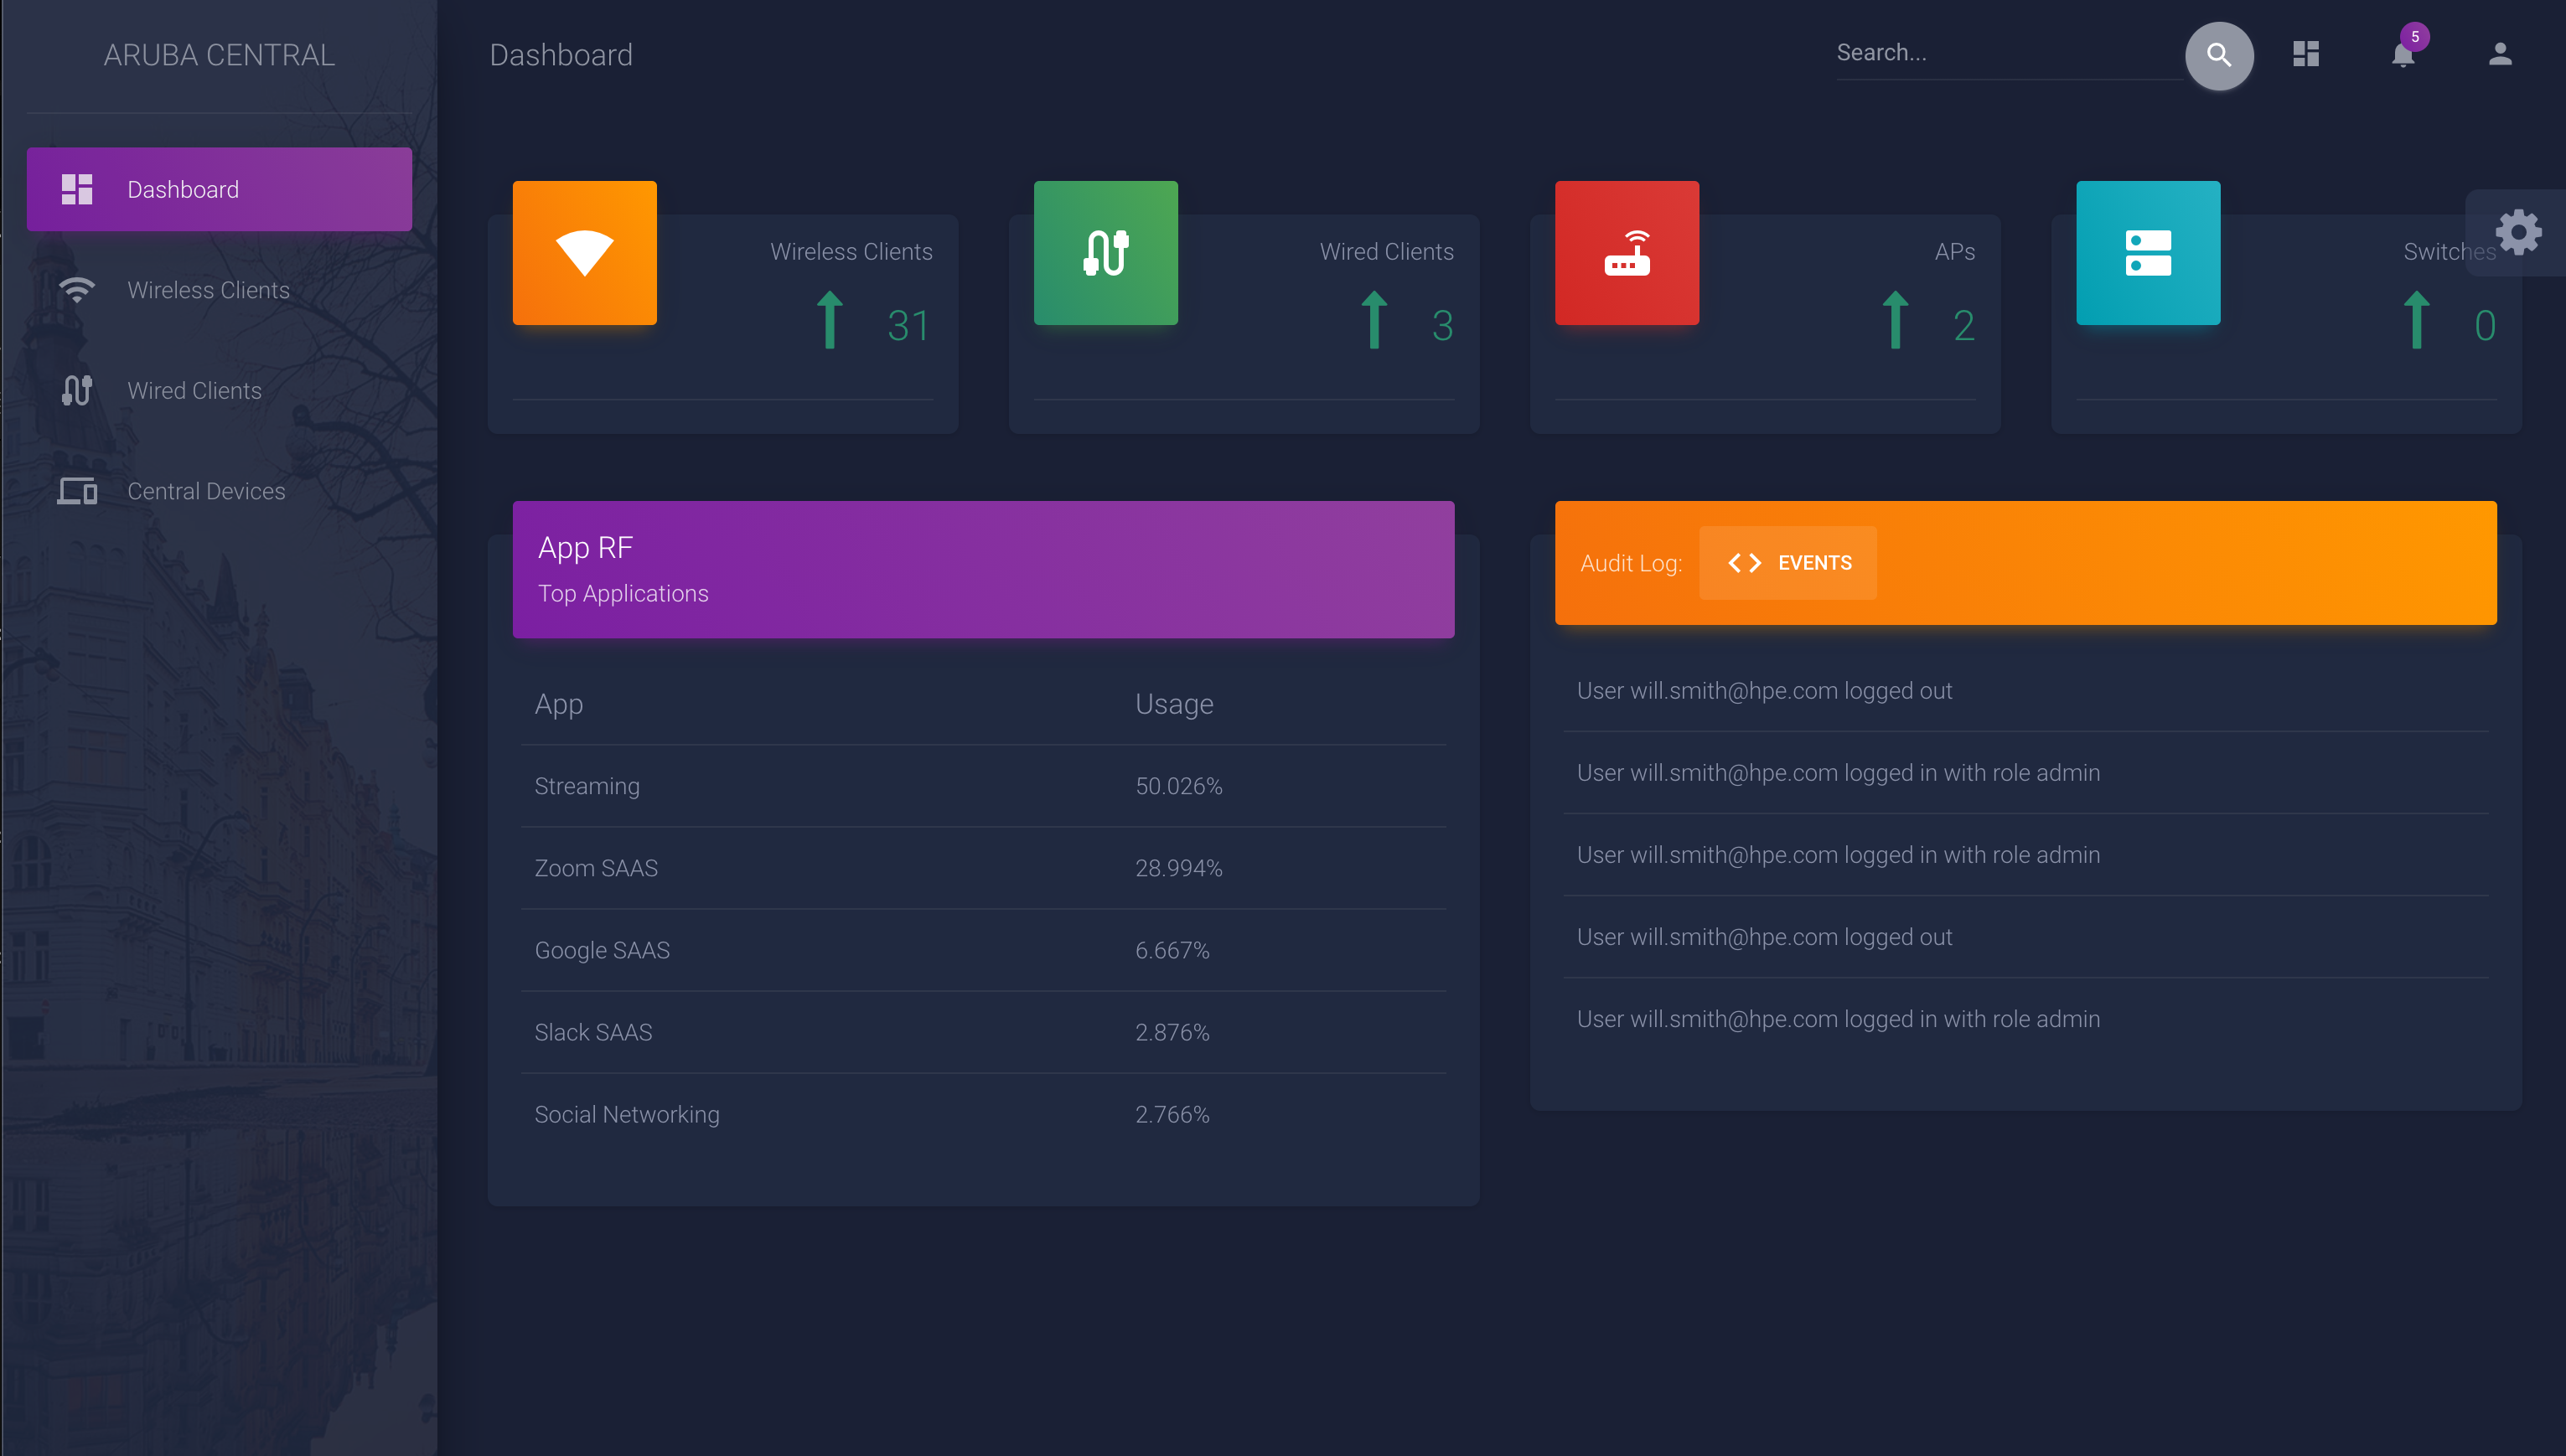
This is the main landing page when you open the web application. This page uses several API calls to pull in data about the current connected users, devices as well as the top AppRF applications and the last 5 events.
Wireless Clients Page:

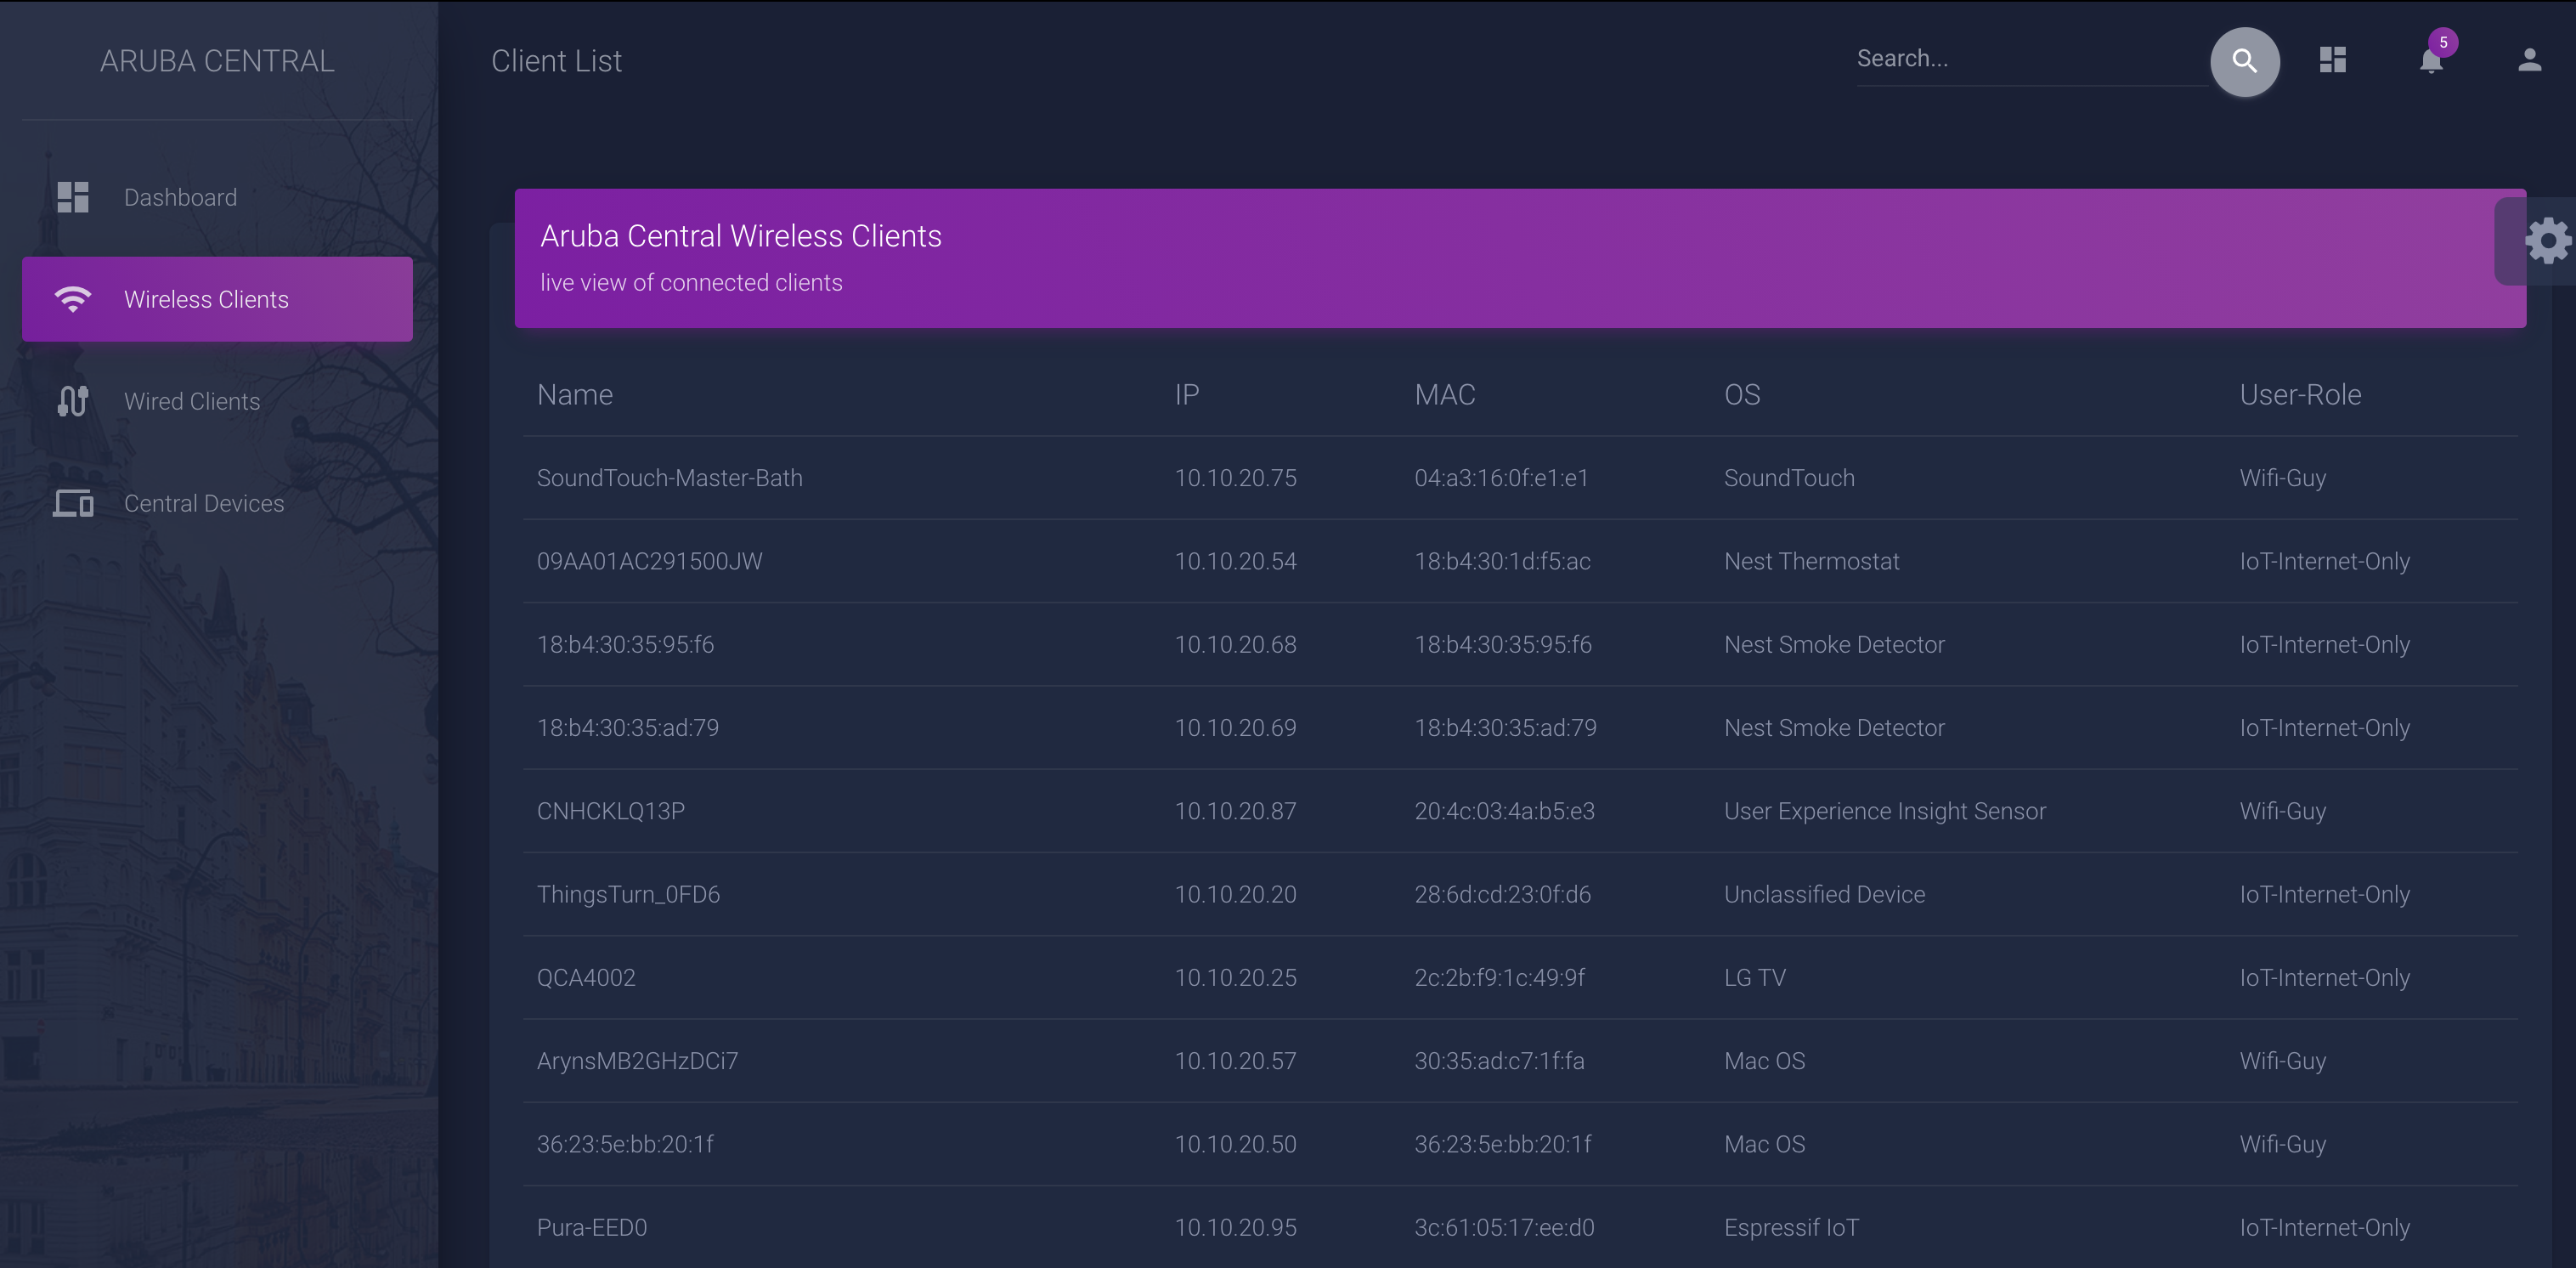
This is the wireless client’s page. This shows a current list of connected wireless clients, name, IP, mac, OS and role. These fields can all be adjusted to whatever values you want to display.
Wired Clients Page:

This is the wired client’s page. This shows a current list of connected wired devices, name, IP, mac, OS and role.
Connected Devices (Inventory) Page:

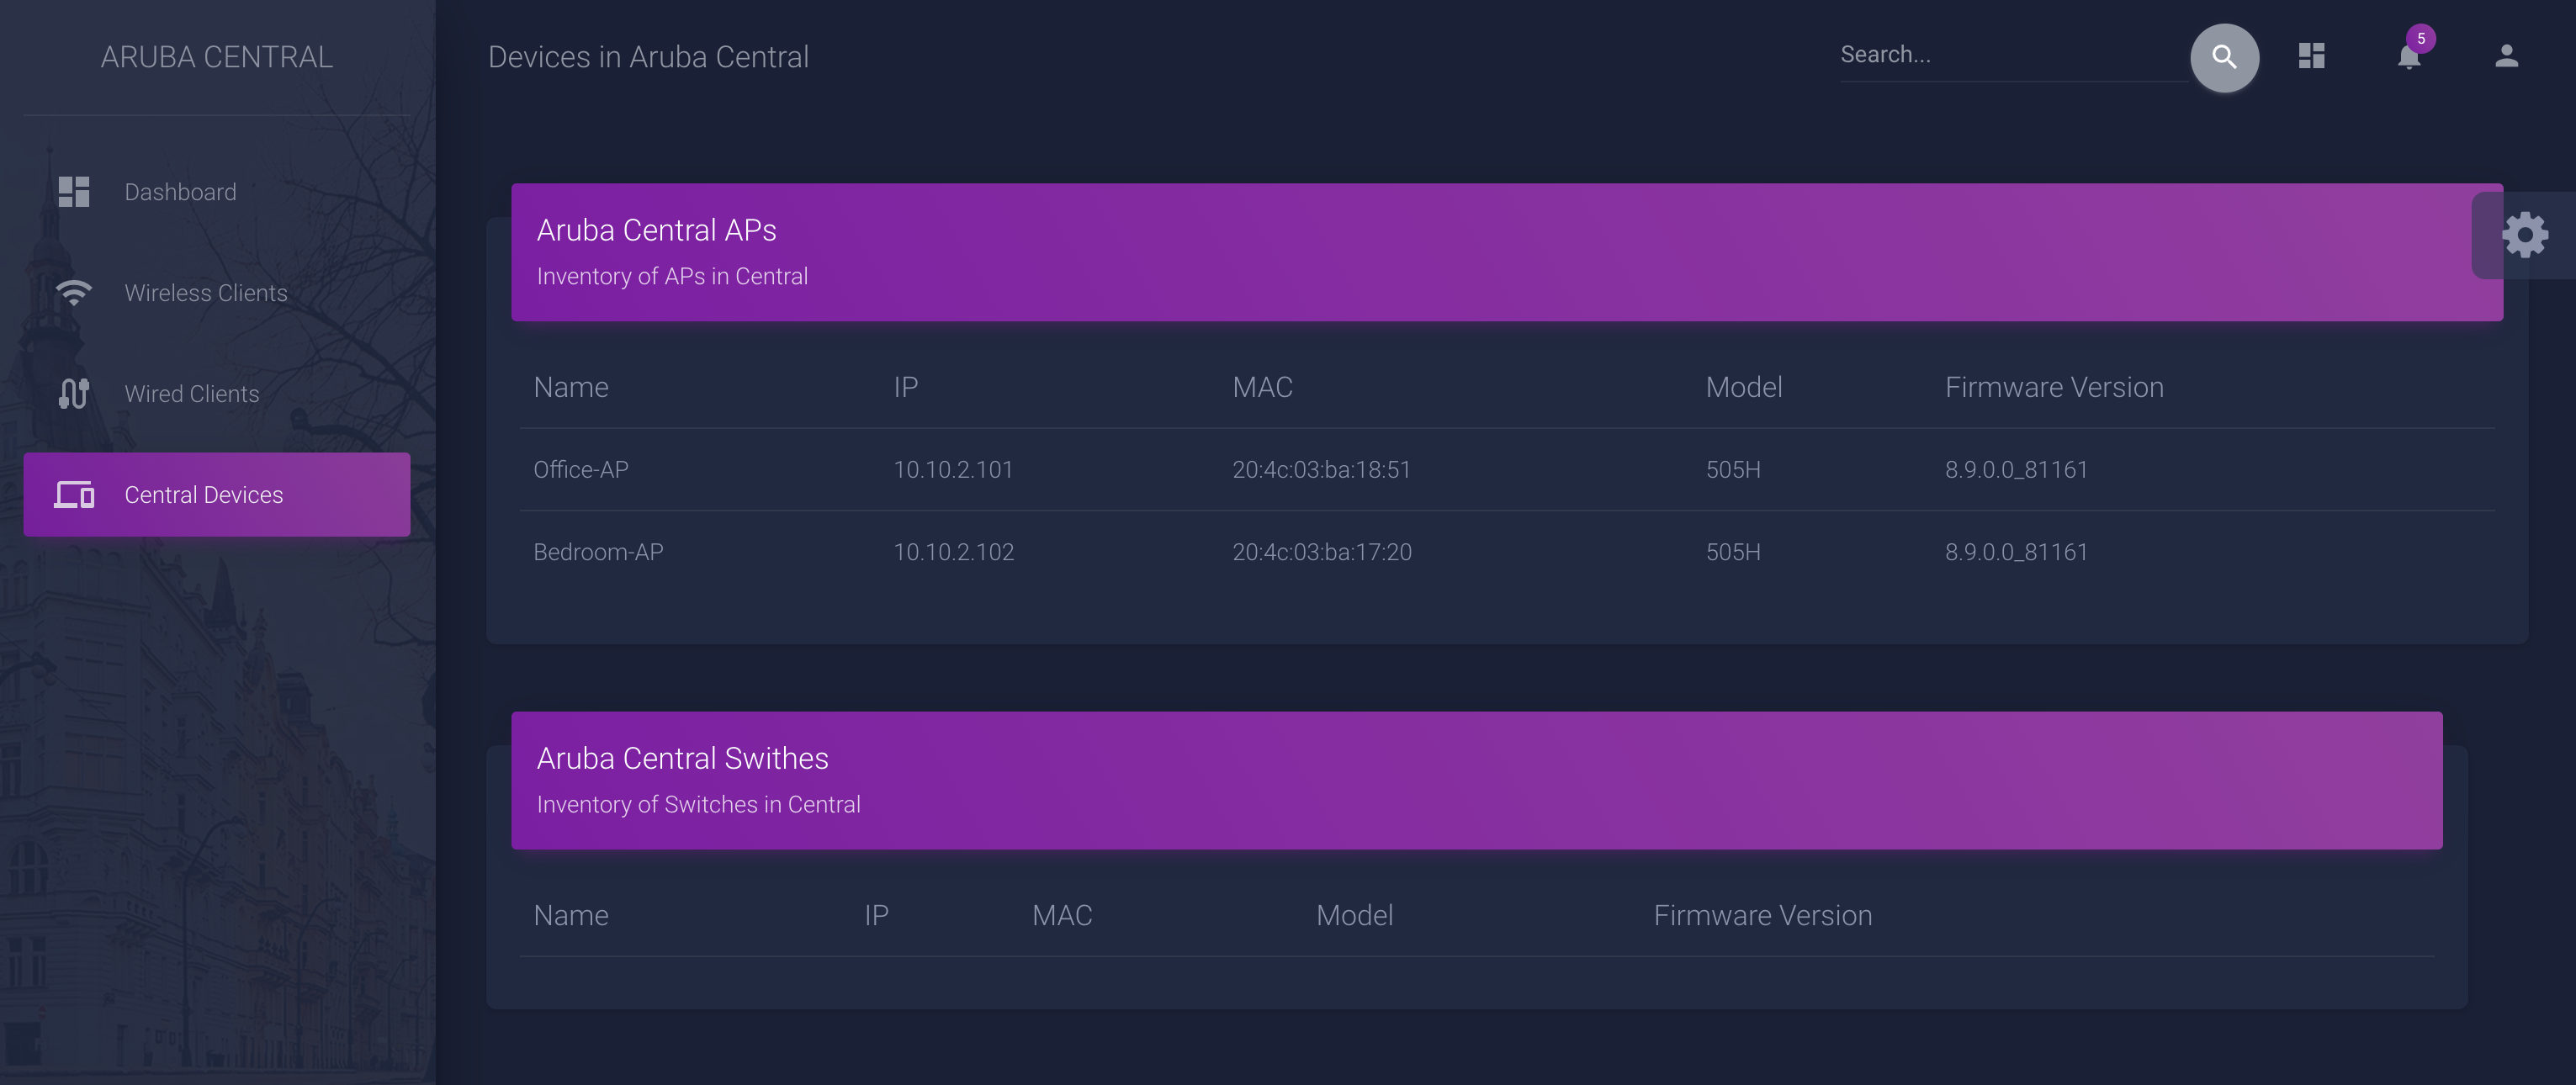
This page displays the list of connected devices. This is a current list of the APs and Switches for the central account. It shows the name, IP, MAC, model, and firmware version. Feel free to modify the fields as needed.